(JPY in Thousands)
| FY2019 | FY2020 | FY2021 | FY2022 | FY2023 | FY2024 Forecast | |
|---|---|---|---|---|---|---|
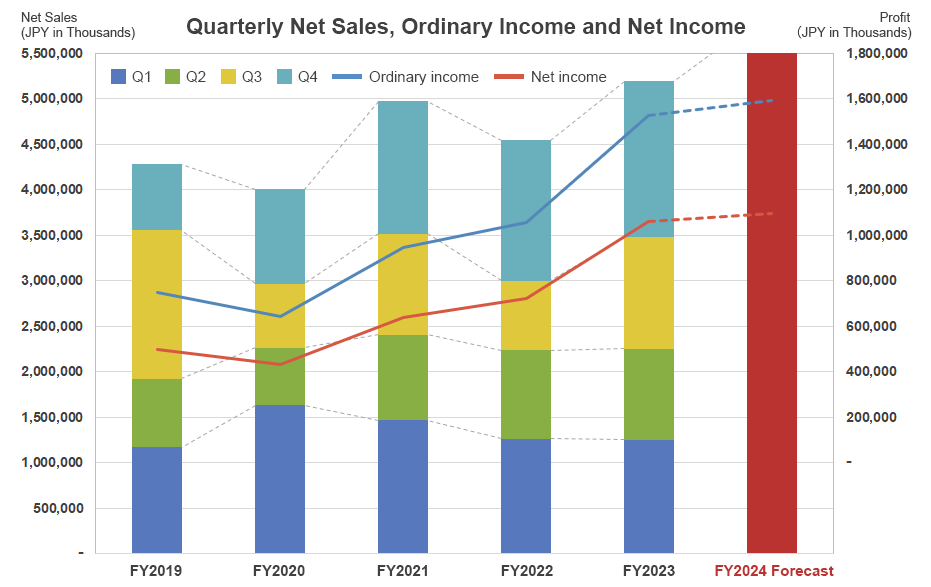
| Net sales | 4,281,539 | 4,004,859 | 4,968,885 | 4,541,242 | 5,191,735 | 5,782,000 |
| Q1 | 1,170,393 | 1,630,912 | 1,462,682 | 1,264,576 | 1,251,802 | - |
| Q2 | 751,319 | 629,139 | 942,696 | 969,065 | 997,439 | - |
| Q3 | 1,629,404 | 707,084 | 1,108,292 | 766,017 | 1,225,097 | - |
| Q4 | 730,422 | 1,037,722 | 1,455,215 | 1,541,583 | 1,717,396 | - |
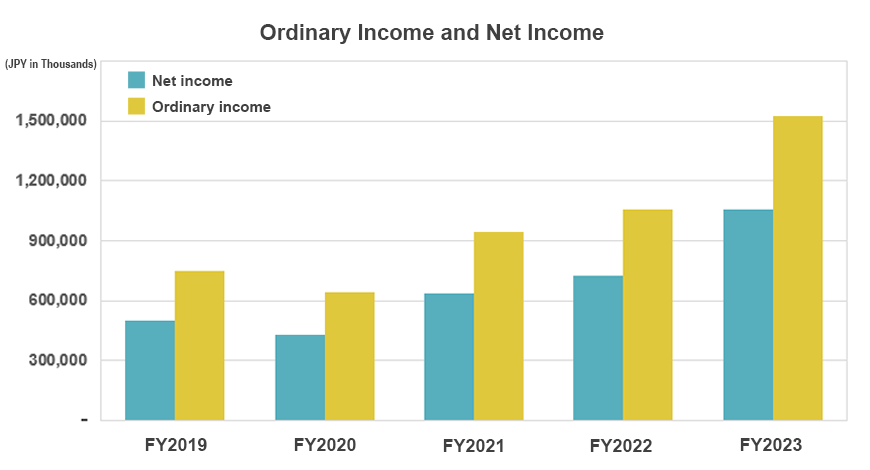
| Ordinary income | 746,551 | 643,362 | 944,593 | 1,055,708 | 1,527,453 | 1,591,000 |
| Net income | 499,249 | 430,457 | 636,027 | 722,779 | 1,059,140 | 1,097,000 |
*Click to zoom in
Quarterly Net Sales, Ordinary Income and Net Income| FY2019 | FY2020 | FY2021 | FY2022 | FY2023 | |
|---|---|---|---|---|---|
| Net sales (JPY in thousands) | 4,281,539 | 4,004,859 | 4,968,885 | 4,541,242 | 5,191,735 |
| Ordinary income (JPY in thousands) | 746,551 | 643,362 | 944,593 | 1,055,708 | 1,527,453 |
| Net income (JPY in thousands) | 499,249 | 430,457 | 636,027 | 722,779 | 1,059,140 |
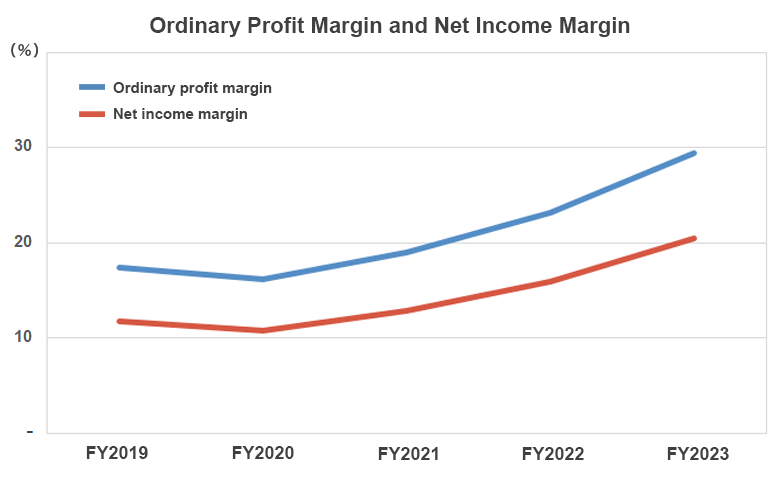
| Ordinary profit margin (%) | 17.4 | 16.1 | 19.0 | 23.2 | 29.4 |
| Net income margin (%) | 11.7 | 10.7 | 12.8 | 15.9 | 20.4 |
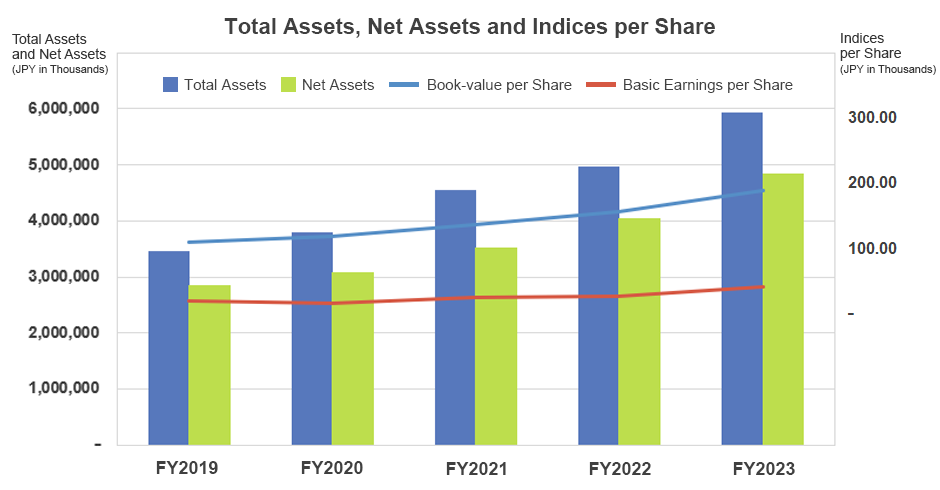
| Net assets (JPY in thousands) | 3,464,967 | 3,796,913 | 4,556,563 | 4,980,780 | 5,934,285 |
| Total assets (JPY in thousands) | 2,842,569 | 3,073,285 | 3,512,533 | 4,042,937 | 4,845,360 |
| Basic earnings per share (JPY) | 19.50 | 16.81 | 24.84 | 28.21 | 41.31 |
| Book-value per share (JPY) | 111.03 | 119.84 | 136.84 | 157.63 | 188.67 |